I wanted to see what would happen when doing only one type of content for a whole month on LinkedIn.
So, during March 2021, I posted a native video on LinkedIn each day. Here’s what happened.
Introduction.
My hypothesis was that people would get bored of seeing a single type of content every day and hence my engagement stats would go down over the month.
Brivvio gave me access to the paid version of their mobile video app so that I could add a custom start and end screen to all my videos as well as using their automated captioning feature.
To keep things consistent, I checked my views, reactions, comments and shares on each post after it had been published for 7 days.
It’s been years since I did my last month of videos, which was for a Facebook Live challenge in October 2016.
Results.
Here are the stats for the video posts made during the March 2021 experiment.
To see the videos only, view my March 2021 Vimeo Collection.
Here are the quick findings I shared in the final video (day 31):
Here’s the info from the above table represented visually. I’ve excluded shares here as the numbers are tiny and, as I’ve blogged about before, shares don’t work on LinkedIn.
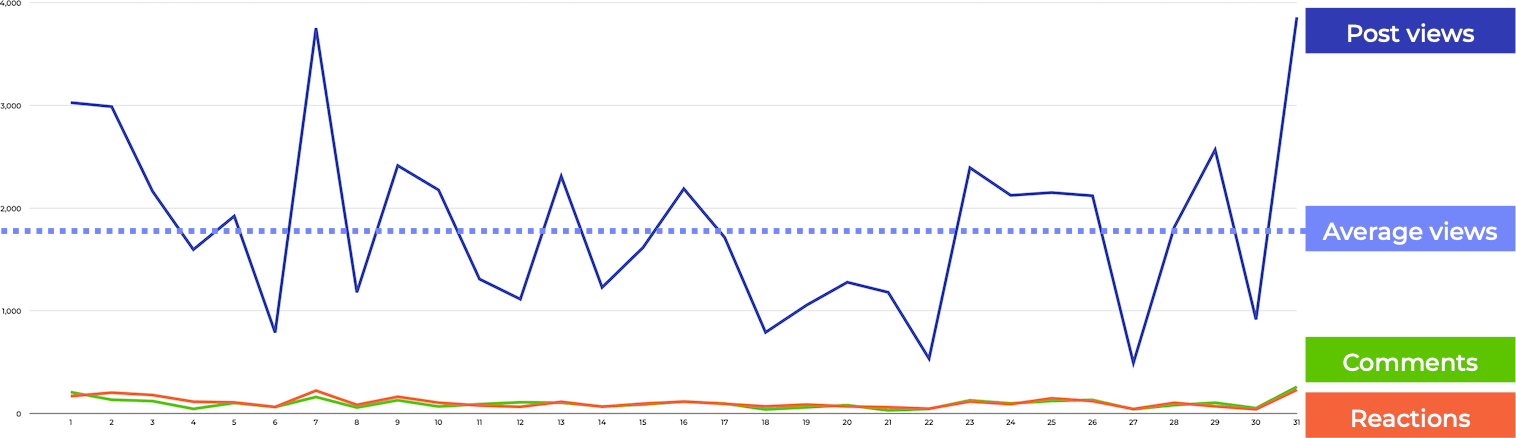
Days 1–6 of the experiment showed a steady decline in views, and I was wondering whether that trend would continue past the first week.
At the rate the view counts were dropping, I was on course for zero views by day 8!
But that dip didn’t carry on for long, and the rest of the month was full of ups and downs.
The top 3 viewed posts in the month were:
| Title | Views | Reactions | Comments | Shares |
|---|---|---|---|---|
| 31. A month of videos – DONE! | 3858 | 231 | 260 | 1 |
| 07. Hashtags in LinkedIn posts | 3752 | 223 | 161 | 2 |
| 01. March 2021 experiment: month of videos | 3027 | 169 | 208 | 2 |
No real surprises there. The opening of the experiment generated some interest and the close included some quick findings. Anything about hashtags is usually popular.
The bottom 3 viewed posts in the month were:
| Title | Views | Reactions | Comments | Shares |
|---|---|---|---|---|
| 27. How to download videos from LinkedIn | 492 | 44 | 41 | 0 |
| 22. How to optimise video file sizes | 534 | 47 | 45 | 1 |
| 06. LinkedIn post view counts | 788 | 64 | 63 | 1 |
Days 27 and 22 didn’t surprise me as the worst performing content, as these were more techie than the other videos.
I was surprised that Day 6 was in the bottom 3, as my explanation of how view counts work on LinkedIn is usually quite popular.
Here’s how my engagement stats for the experiment in March 2021 compared with past videos I’ve done since 2019:
| Period | Count | Views | Reactions | Comments | Shares |
|---|---|---|---|---|---|
| Mar 2021 | 31 | 1831 | 108 | 98 | 1 |
| Jan–Feb 2021 | 6 | 3047 | 92 | 93 | 1 |
| Jan–Dec 2020 | 25 | 2211 | 117 | 88 | 2 |
| Jan–Dec 2019 | 42 | 5060 | 143 | 97 | 6 |
So, the videos shared in my experimental period performed worst of all measured periods in terms of views. The comparison with previous periods in terms of reactions and comments isn’t so bad.
This relatively poor view performance comes despite my following general best practices for video creation during the experiment, specifically:
- Creating square video, which takes up 78% more space in the feed compared with landscape video.
- Keeping the videos short – an average of 93 seconds per video, with only 3 of the 31 videos being longer than 3 minutes.
- Adding captions (subtitles) to all videos and including #Captioned on all video posts.
So, despite making all the right moves (I think!), my videos didn’t perform well during the experimental period.
I see two possible reasons for this:
- My overall engagement stats are down compared with the stats for 2020, and this experiment is reflecting that decline.
- People were bored of seeing only one type of content from me all month.
I was expecting the second of these reasons to be justified by a steady drop in engagement during the month. But the tables and graph above show no real evidence of that.
In the first 3 weeks of the experiment, there was an overall downward trend, but that changed to an upward trend in the final week. I don’t think we can conclude from that that people were becoming increasingly bored by the content.
Other factors that could have influenced the relatively low engagement stats:
- All of the posts started with the same opening characters: 🎬 N/31: – perhaps this could have been more engaging.
- Almost all of the posts started with a shot of my face. This looks samey and perhaps some people thought they’d already seen some of the videos when in fact a new item had been put into their feed and they skipped it without realising.
Creating the videos.
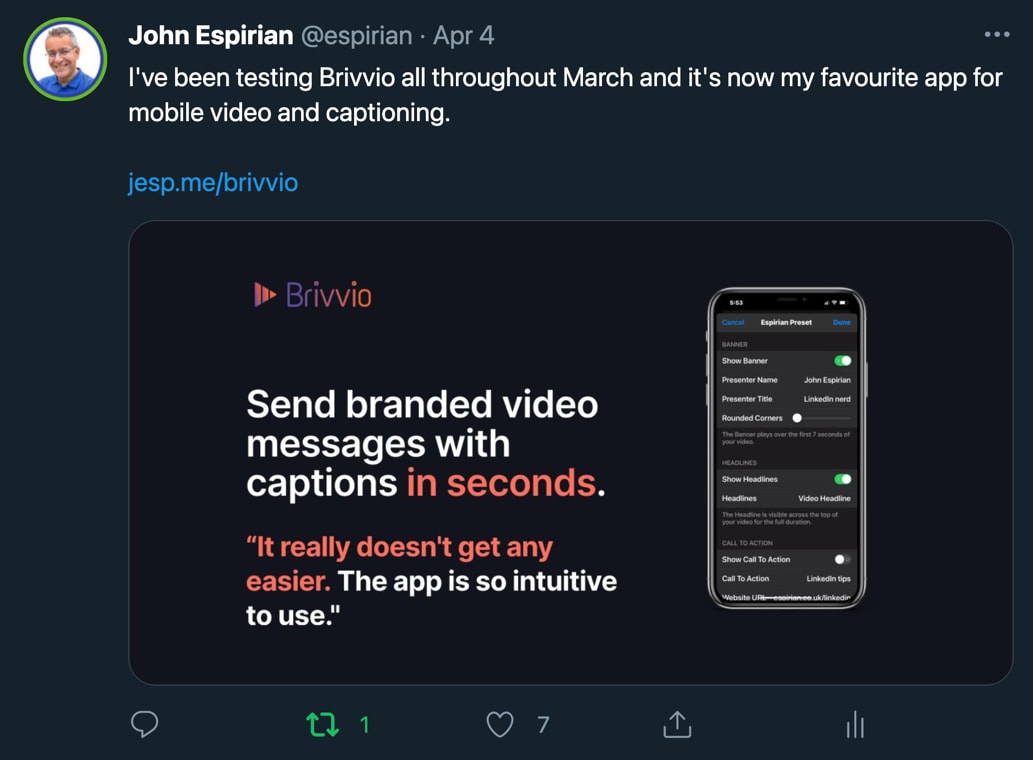
Even though the engagement stats weren’t great, I did enjoy my new workflow of creating and captioning my videos via Brivvio.
I had thought I was going to do everything via Brivvio but when I realised that I needed to do a mix of face-to-camera and screen-sharing content to make some of the videos, I decided that I needed to create most of the source material in Camtasia.
I’ve discussed creating videos before so I’m not going to dig into that here. One point to note is that editing so much video in a short period made me a lot more efficient at using Camtasia. (If you use Camtasia and haven’t tried magnetic tracks yet, they’re a huge timesaver!)
Here’s a very quick look at Brivvio, which is now my preferred app for mobile video captioning:
Non-video content during the experiment.
Although my plan was to post only video content each day in March 2021, I did veer off on a couple of occasions.
That’s because I had my first pro photoshoot in 18 months during that month, and didn’t want to wait to share the results. Therefore, I added these posts into the mix:
| Title | Views | Reactions | Comments | Shares |
|---|---|---|---|---|
| Remote photoshoot results with John Cassidy | 15,649 | 143 | 263 | 1 |
| New Profile Pic | 11,296 | 345 | 180 | 1 |
| Average | 13,473 | 244 | 222 | 1 |
As you can see, the engagement stats for this document post and video post vary a lot from the earlier numbers for the video posts.
But remember that view counts for videos are calculated differently from view counts of all other content on LinkedIn, so it’s hard to make a direct comparison of the stats. Refer to my article about view counts on LinkedIn for more about this.
Let’s wrap up.
My videos didn’t perform brilliantly during the experiment but I still attracted a lot of engagement on my posts and that included a lot of positive feedback via direct message.
Your best results on LinkedIn are likely to come from mixing up your content types by making text posts, image posts, video posts, document posts and polls.