Log your LinkedIn post analytics to help you do more of what works.
Do text posts work best for you? Do you get more comments from video posts? What are your most popular posts?
It’s important to know what works on LinkedIn so that you can post content that’s effective for your audience.
This post shows how I record this information, using a combination of an Excel spreadsheet and data gathered via SHIELD Analytics.
Try SHIELD Analytics.
Go to shieldapp.ai?via=john and use code JOHNESPIRIAN15 to get a 15% discount on your first year of SHIELD Analytics.
I use SHIELD for all my LinkedIn analytics!
⭐️⭐️⭐️⭐️⭐️
- How my LinkedIn stats spreadsheet works
- Free Excel template for recording LinkedIn post stats
- Let’s wrap up
Did you know?
Your LinkedIn post analytics are available for 60 days from creation.
Your LinkedIn article analytics are available for 2 years from creation.
How my LinkedIn stats spreadsheet works.
I use 2 tabs for recording my LinkedIn post stats:
- Stats: all the details for each post
- Summary: a calculated summary of performance
Stats tab.
I’ll cover this tab in order of the columns.
URL column.
I copy the link for each LinkedIn post and paste it here for future reference.
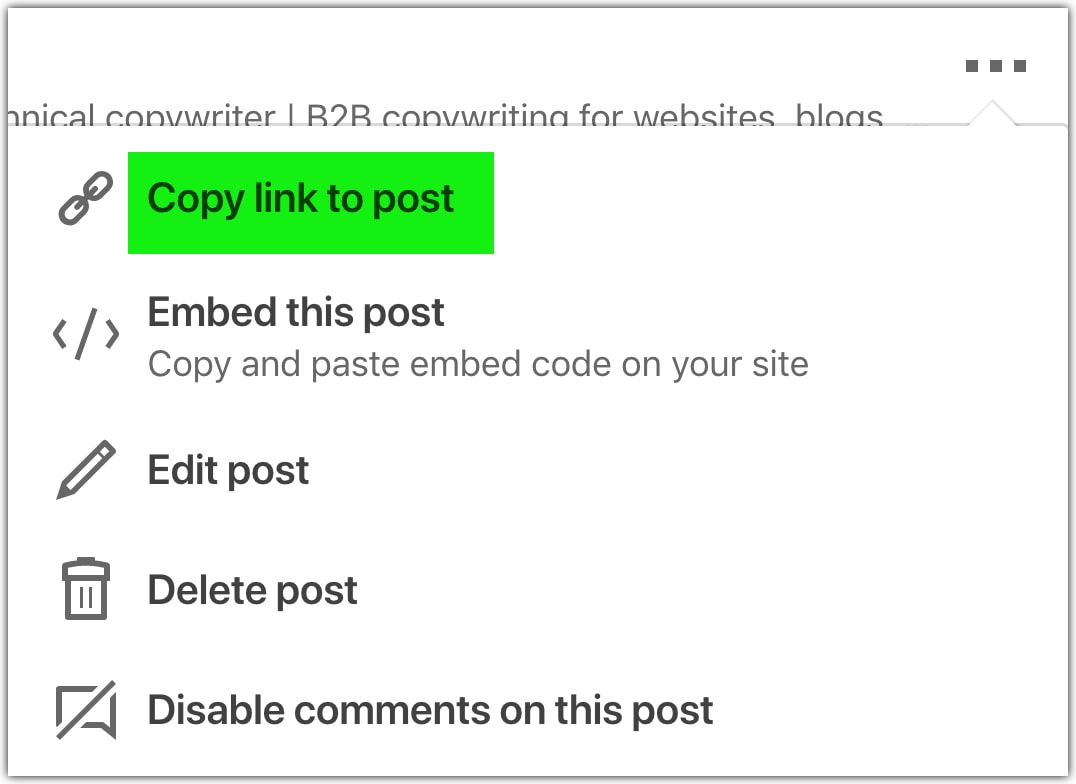
To get the URL of a post, click the ellipsis (…) menu in the top-right corner of the post and click Copy link to post.

Because LinkedIn URLs are long and not that nice to read in an Excel sheet, I narrow the column and set the text to fit the cells.
The text becomes unreadably small but that’s OK because clicking on any cell reveals the full text in the cell bar at the top of Excel.
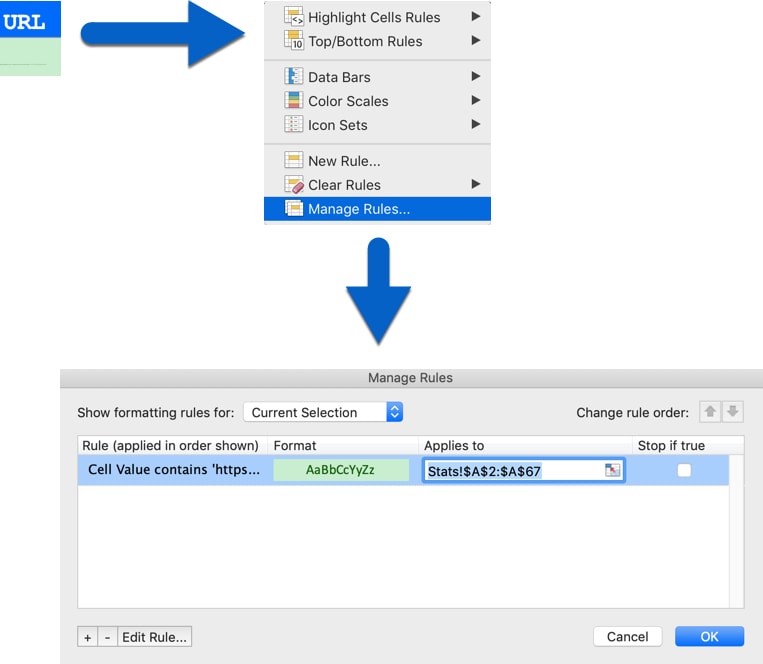
To make sure I haven’t pasted in the wrong type of content into the cell, I use a conditional formatting rule on the first column. The rule says that if a cell contains ‘https’ (i.e. the start of a LinkedIn web address) then the cell is automatically coloured green.

Conditional formatting sounds fancy, but it’s just a way of applying simple rules to a range of cells.
Title column.
I always start my LinkedIn posts with an emoji and a single line of text. I copy that single line of text into this column, and it acts as the title of my post.
Type column.
The type of post: it’s always Text, Image, Video, Doc or Poll.
Views, Reactions and Comments columns.
These should be self-evident. Each post displays a count of the views, reactions and comments.
I take readings 1 week after I originally publish each post (used to be 2 weeks but I changed this in February 2021 so that I could gather my stats more quickly).
Shares column.
When you click the view counter on LinkedIn desktop, a new panel opens that is meant to show how many times the post was shared. In practice, this often doesn’t work. The panel opens but doesn’t always reveal the share count.
The tricky bit is that this is the correct behaviour if the post hasn’t been shared. Rather than showing something sensible such as “Shares: 0”, LinkedIn opts not to show any share information at all.
But if the post has been shared and the data isn’t shown in the panel, you might think that there have been no shares. Frustrating!
The most reliable way to check for shares is to look at the same view stats panel on the LinkedIn mobile app.
Also, if you use a branded hashtag on your posts, searching LinkedIn for that hashtag will reveal shares of your posts. You can do this on LinkedIn desktop, which makes it a more convenient way of discovering shares.
Date posted column.
The original date of publication.
Excel tip.
Press Ctrl-; to insert the current date in a cell.
Works on macOS and Windows.
Date checked column.
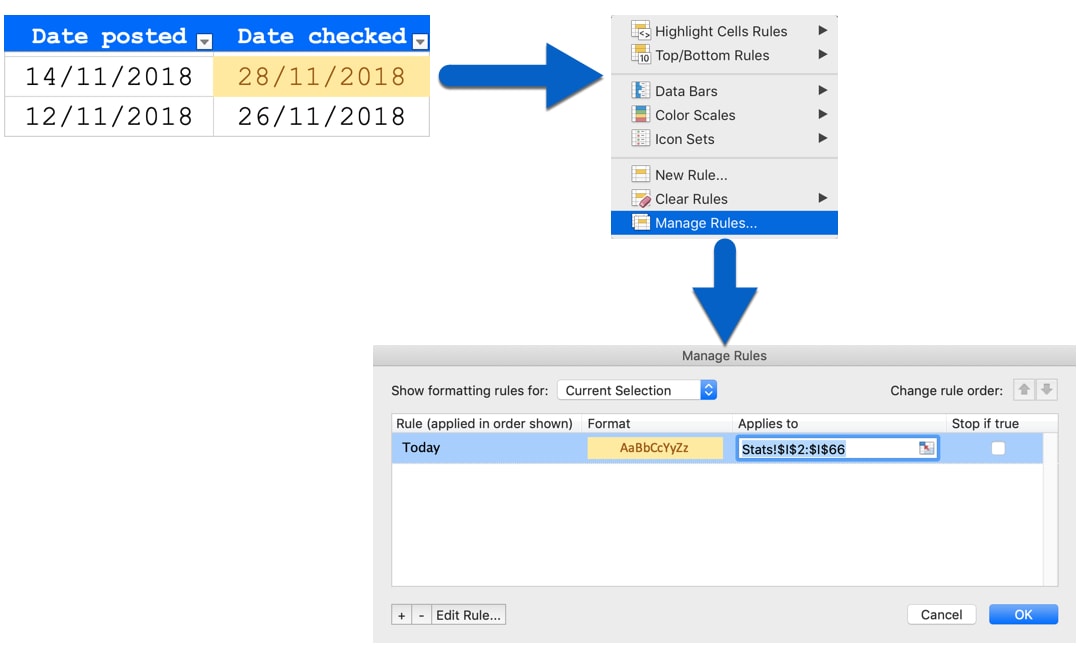
I set this to 1 week (formerly 2 weeks) after the Date posted date by using a formula that adds 7 (for days) to the Date posted cell value.
To make it easier for me to spot when the 7 days have passed, I use more conditional formatting to say “if the date is today, mark the cell in gold”.

Additional info column.
I use this to record any extra notes about the post, e.g. for posts that are published on the weekend (unusual for me).
Summary tab.
This tab contains a table where the data is calculated via formulas.
The table displays average counts for reactions, views, comments and shares for each of the post types.
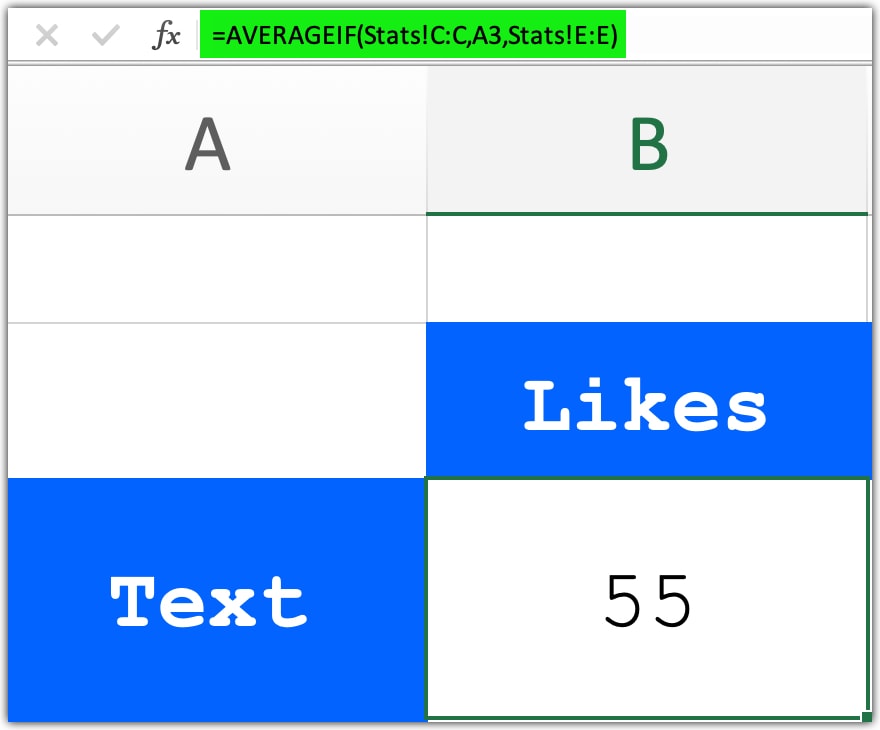
The AVERAGEIF formula does the job here. Here’s an example of how it works:
- Look in the Stats tab for all rows that are text posts.
- Take an average of all the likes for those text posts.
This is what that formula looks like:

AVERAGEIF formula to calculate average likes, comments, views and sharesI then repeat this formula to do the same calculations for comments, views and shares for all post types.
Finally, I have a couple of extra columns to calculate the average views per reaction and views per comment. This shows how many views it takes on average to receive a reaction or comment on a given post type.
Free Excel template for recording LinkedIn post stats.
Here is my Excel sheet so you can see how it works and use it for your own data logging.
Let’s wrap up.
If you’re serious about improving your LinkedIn presence, track the performance of your posts and then do more of what works.
My Excel template should help you, but remember that any logging is better than none.
Try SHIELD Analytics.
Go to shieldapp.ai?via=john and use code JOHNESPIRIAN15 to get a 15% discount on your first year of SHIELD Analytics.
I use SHIELD for all my LinkedIn analytics!
⭐️⭐️⭐️⭐️⭐️


