My February 2021 experiment tested whether delaying replies to comments for the first 3 hours after publishing my LinkedIn posts would have a negative impact on the visibility and engagement on those posts.
Introduction.
It’s often said that you need to be around to reply to early engagement on your LinkedIn posts if you want those posts to have maximum visibility in the feed.
People have previously mentioned there being a “golden hour” directly after a post’s publication during which time comments should be left – both by your followers and by you in replying.
Recent speculation about changes to the LinkedIn algorithm seems to suggest that this window of opportunity – the golden hour – has been extended to be 2 or 3 hours.
This is good news if true because a widening of the engagement window would help to dilute the potency of engagement pods, which I rail against in my LinkedIn course.
I wanted to test whether early responses to engagement on posts really mattered, so I decided to do an experiment in February 2021. This would involve deliberately avoiding replying to comments for the first 3 hours after each of my posts were published.
As I stated in the January post to announce my plan to do this experiment:
True enough, it was a tough one to commit to.
A quick summary of the results, taken from a chat with LinkedIn trainer Lynnaire Johnston:
The experiment.
I made a note of the time of publication of each post during February 2021 so that I could check the engagement stats after exactly 3 hours.
I could then compare this with the “final” stats that I gathered a full 7 days later, to look for any interesting correlations.
Here are the posts made during February 2021, showing both the 3-hour stats and the 7-day stats for each piece of content.
To save space, I’m not including data about shares, as the numbers are always low and never particularly interesting. See my article that explains why sharing posts on LinkedIn isn’t effective.
3-hour stats.
7-day stats.
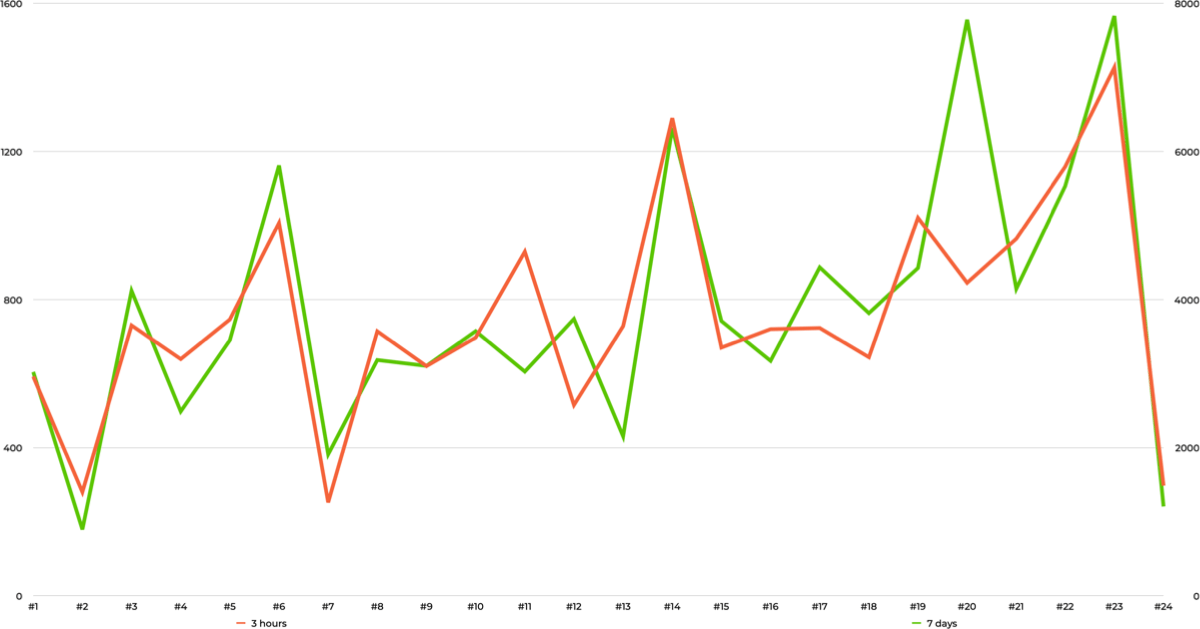
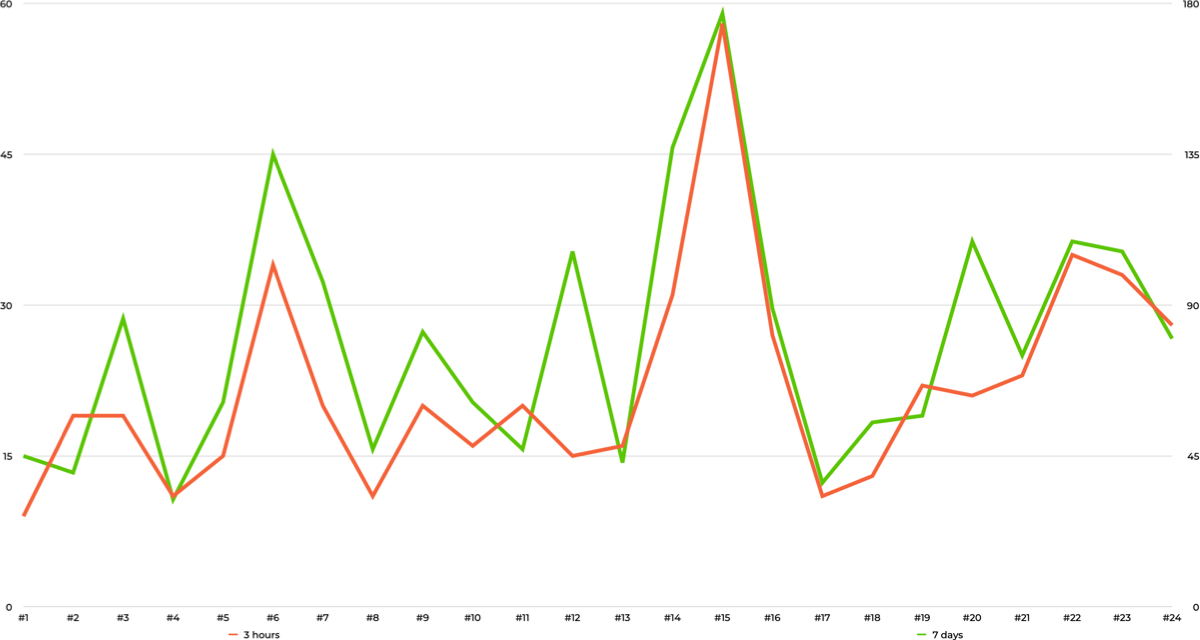
Here’s how the 3-hour stats (orange) compare with the 7-day stats (green).
Views.
Reactions.
Comments.
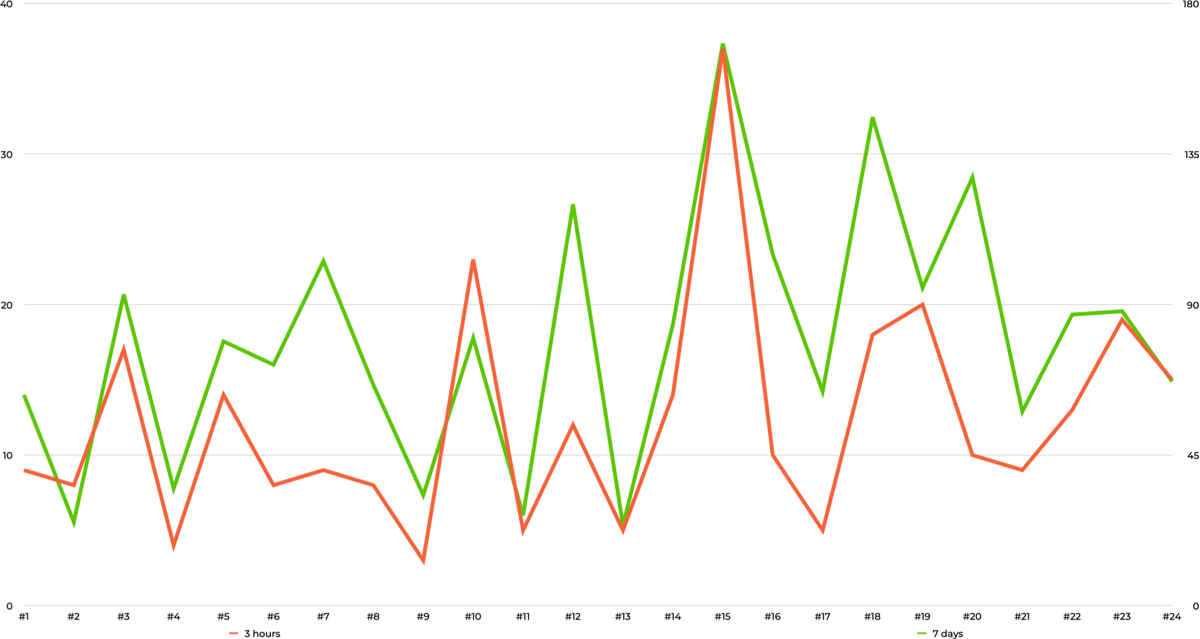
The 3-hour stats for each post are a pretty good indicator of the 7-day performance.
There are some exceptions:
- Post 20 had more views than expected.
- Posts 3, 12 and 20 had more reactions than expected.
- Posts 6, 7, 12, 18 and 20 had more comments than expected.
I can’t see anything obvious to explain what happened in these cases.
It’s hard to conclude anything from a small dataset of only 24 posts, but the view count measures over 3 hours and 7 days seemed to correlate well: in other words, 3-hour views were a good predictor of 7-day views.
During this experiment, my 7-day view counts were on average 5.1× higher than the 3-hour view counts, and the variance was low (16 of the 24 posts were in the 4× and 6× range).
Here’s how my engagement stats for the February 2021 experiment compared with my averages for the previous 6 months.
| Month | Views | Reactions | Comments |
|---|---|---|---|
| Aug 20 | 9499 | 173 | 103 |
| Sep 20 | 7080 | 126 | 85 |
| Oct 20 | 5866 | 110 | 89 |
| Nov 20 | 10146 | 223 | 136 |
| Dec 20 | 4774 | 96 | 93 |
| Jan 21 | 8076 | 124 | 120 |
| Average | 7574 | 142 | 104 |
Compare the above 6-month average with the average during the February experiment and you’ll see that there was a significant drop in all engagement stats:
| Month | Views | Reactions | Comments |
|---|---|---|---|
| Feb 21 | 3868 | 80 | 80 |
| Change | –49% | –44% | –23% |
Let’s wrap up.
The stats suggest that there was a negative impact associated with not replying to comments for 3 hours after my posts were published.
So, when you post content on LinkedIn, make sure you’re around to do at least a little bit of “babysitting” to help the post achieve the full visibility it’s capable of.